
One of our background jobs was so slow that users assumed it was broken. They would kick it off, wander away, knowing it would take ages to complete. Turns out the job was fine. It was just taking its sweet time.
We eventually cut its runtime by about 80%, and the fix was so small it was almost insulting. You could have stared at the code for hours and missed it. A profiler found it in minutes. This post is about how to think about profiling so you reach for it at the right moment, not as a first reflex.
Performance is a KPI, Not a Vibe
It's easy to treat performance as something you tune when someone complains. But latency is a feature, and a slow background job has real downstream costs: a worse user experience, more compute burned, queues backing up, and a quietly growing tolerance for "well, that's just how long it takes."
The mindset shift that helped us was treating performance like any other key metric we hold ourselves accountable to. That means it has to be measured, it has to have a number, and that number has to move in a direction we choose on purpose. "It feels faster" is not a result. "p95 went from 214 seconds to 69 seconds on a representative input" is a result. Which raises the obvious question: Once you've decided to take a number seriously, how do you find out where the time actually goes?
Profilers, And How They Work
A profiler answers one question very well: Inside a single execution of code, where is the time being spent?
We can get that answer using one of two broad strategies:
- Instrumenting (tracing) profilers wrap every method call to record when it starts and stops. You get extremely precise, complete call counts and timings. But the overhead is high, and that overhead can distort the very timings you're trying to measure. Wrapping millions of tiny method calls makes the cheap ones look expensive.
- Sampling profilers take the opposite approach. Instead of instrumenting every call, they periodically interrupt the program — say, hundreds of times per second — and record whatever stack is currently running. No single sample tells you much, but in aggregate the math works out: a method that shows up in 40% of samples is, statistically, where about 40% of the time is going. The overhead is low and roughly constant, which makes sampling profilers safe to run in places instrumenting profilers can't go — like production.
Vernier is a modern sampling profiler for Ruby. A few things make it well-suited to the kind of work we're describing:
- It's a sampling profiler, so overhead is low enough to run against real workloads.
- It's thread-aware. It can show you what's happening across multiple threads, garbage collection and idle waiting. This holds little importance for the current article, but if we were parallelizing queries to the database, this would be of paramount importance.
- Its output opens directly in the Firefox Profiler UI, so you get flame graphs and stack charts without building any tooling yourself.
The output is the important part. A flame graph shows you the call tree with the width of each frame proportional to time spent. The wide bars are where your time lives. You learn to scan for a suspiciously fat frame and ask, "Why is that so wide?".
The output also gives you a stack chart, which is what helps you spot what could be parallelized. A flame graph alone can mislead you here: You may see that building a query's input takes about 40% of the time and running the query takes the other 60%. But that tells you nothing about whether the two can overlap. However, switch to the stack chart and you'll notice that those two stages each run 60 times. Now, a different picture emerges — that repetition is your opening to spread the work across multiple threads or multiple jobs.
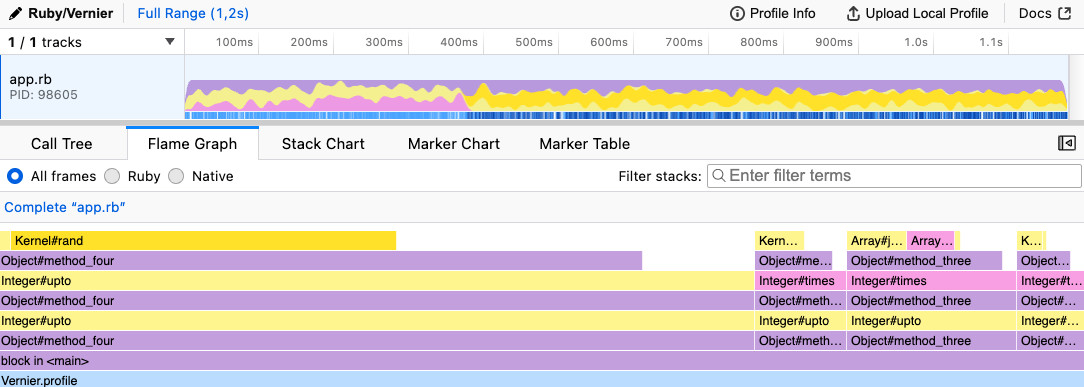
Example of a flame graph with one method taking more time than the others.
What Profiling Does Not Replace
Here's the trap: A profiler is so satisfying to use that it's tempting to make it your first move. It shouldn't be. Profiling is a precision instrument for one process at one moment in time. It sits alongside the rest of your observability stack, not on top of it.
- Metrics and dashboards tell you what is slow and how often, across all processes, over time. They answer "which of our hundreds of jobs is the problem, and is it getting worse?" A profiler can't see trends or aggregates — it sees one run.
- Distributed tracing (e.g., OpenTelemetry) follows a single request as it crosses process and service boundaries — the database, the cache, external APIs. It tells you where in the system the time goes. A profiler lives inside one process and can't follow a call out to another service.
- Logging gives you discrete, queryable events with business context — the narrative of what actually happened, with the IDs and states you need to reproduce it.
In our case, we didn't skip any of those steps. It was a Grafana dashboard tracking our Sidekiq job durations that flagged the slow job in the first place — and ranked it against everything else running. That's where dashboards shine. Only after the dashboard pointed us to a specific, repeatedly slow job did we have a good reason to profile it.
The rule of thumb we landed on: Use your dashboards and traces to decide where to aim, then use the profiler to find out why.
Profiling in Production With Vernier
The simplest way to use Vernier is to wrap the slow code and write the profile to a file
Vernier.profile(out: "profile.json") do
  some_slow_method
end
Run that, then open profile.json in the Firefox Profiler. That's the whole loop.
The interesting part is where you run it. For a lot of jobs, your laptop or a staging box is a fine place to profile. Ours wasn't. The job's behavior depended heavily on a large, realistic dataset, and our non-production machines simply didn't emulate production well enough to reproduce the slowness. So we profiled in production — carefully. A few hard-won rules:
- Profile in an environment as close to production as you can get. If the bottleneck only shows up at production scale, profiling a toy dataset will send you chasing the wrong frame.
- Profile and benchmark separately. Profiling adds its own overhead and changes the timings. Use profiling to find what's slow, then benchmark the before/after of your fix in a clean run. Don't try to do both at once.
- Know the side effects before you start, and know how to undo them. Profiling a job that creates 100k records in a real database is not a read-only operation. Before you run it, answer the question: how do I delete those records and their associations afterward? Have the cleanup ready before you press go.
- Get the profile off the box. Once the profile is written inside a container or pod, you still need it on your machine to view it. Whatever your platform's mechanism is for copying a file out of a running pod, work that out ahead of time.
Let Sidekiq Do The Wiring For You
If the slow code is a Sidekiq job — as ours was — you don't even have to wrap it by hand. Sidekiq ships with a profiling integration built on top of Vernier that lets you capture a profile of a single job run straight from the Web UI, then download the result. It's purpose-built for exactly this situation: You have a specific job that is slow in production, and you want a real profile of a real execution.
What We Learned
With the profile open in front of us, one frame was wider than it had any right to be: a Redis fetch, called from deep inside a per-record builder, showing up over and over.
The code looked reasonable. We had a class that built one record, and a parent class that built all of them. For simplicity's sake, here they are in a single code block:
module RecordBuilder
  class BuildAll
    def initialize(user_ids:)
      @user_ids = user_ids
    end

    def call
      users.map do |user|
        Build.new(user: @user).call
      end
    end
  end

  class Build
    def initialize(user:)
      @user = user
    end

    def call
      Record.new(**record_attributes)
    end

    private

    # "Cached" lookup... but watch where it's memoized.
    def record_attributes
      { reference_id: reference_data[@user.ref_name] }
    end

    def reference_data
      @reference_data ||= ReferenceDataRepo.fetch_all
    end
  end
end
See it? The reference_data lookup is memoized — but it's memoized on the Build instance, and we create a brand-new Build for every single record. So @reference_data ||= ... is a fresh, empty instance variable every time, and we fetch the entire reference dataset from Redis once per record. For a batch of tens of thousands of records, that's tens of thousands of Redis round-trips to fetch data that never changes during the run.
The fix is to fetch it once, at the level where "once" actually means once — the parent — and pass it down:
module RecordBuilder
  class BuildAll
    def initialize(user_ids:)
      @user_ids = user_ids
    end

    def call
      users.map do |user|
        Build.new(user: @user, reference_data:).call
      end
    end

    private

    # Fetched once for the entire batch.
    def reference_data
      @reference_data ||= ReferenceDataRepo.fetch_all
    end
  end

  class Build
    def initialize(user:, reference_data:)
      @user = user
      @reference_data = reference_data
    end

    def call
      Record.new(**record_attributes)
    end

    private

    def record_attributes
      { reference_id: reference_data[@user.ref_name] }
    end
  end
end
N Redis fetches became 1. Then we benchmarked the before and after on a representative batch of ~45k records in production went from 8.95s to 1.44s. About a 6x improvement on that one piece, from a change you could fit in a tweet.
What's worth sitting with is that this was already memoized. A code reviewer skimming it would see @reference_data ||= and tick the "caches the lookup" box. The building step wasn't a missing cache — it was a cache scoped one level too low. That's exactly the kind of thing you don't catch by reading and do catch by measuring.
In Closing
The headline lesson isn't "use Vernier," though you should — it's a great tool. It's about sequence. Treat performance as a number you own. Lean on dashboards, traces and logs to figure out where the problem lives. Then, and only then, point a profiler at the specific slow thing and let it tell you the truth, which is frequently not the thing you assumed.
For us, the profiler turned a vague "this job feels slow" into a precise "you're talking to Redis 45,000 times for no reason." That's the difference profiling makes: It replaces a hunch with a flame graph. If you want to try this on a slow Sidekiq job of your own, start with the Sidekiq profiling wiki and Vernier.
Special thanks goes out to Brian Dillard, and Sarah Reid for reading drafts of this blog post, and for giving me their feedback!
Be sure to follow @doximity_tech if you'd like to be notified about new blog posts.